Quantitative Risk Assessment Models for Infrastructure Projects
Explore key quantitative risk assessment models for infrastructure projects to make informed decisions and enhance project success.

Infrastructure projects are complex and risky. Smart project managers use these 4 key models to measure and analyse risk:
- Monte Carlo Simulation
- Fault Tree Analysis (FTA)
- Failure Mode and Effects Analysis (FMEA)
- Decision Tree Analysis
Here's a quick comparison:
| Model | Best For | Example |
|---|---|---|
| Monte Carlo | Complex projects | HS2 cost risk check |
| FTA | Specific failure points | Crossrail signalling |
| FMEA | Early design | Lower Sava River project |
| Decision Tree | Clear decision points | State Road No. 51 in Italy |
These models help teams:
- Measure and analyse risk
- Make smart choices
- Avoid potential disasters
But here's the kicker: only 27% of organisations always use risk management in their projects. Another 35% use it sometimes.
That's a lot of projects flying blind. Let's dive in and see how these models can keep your infrastructure project on track.
Monte Carlo Simulation
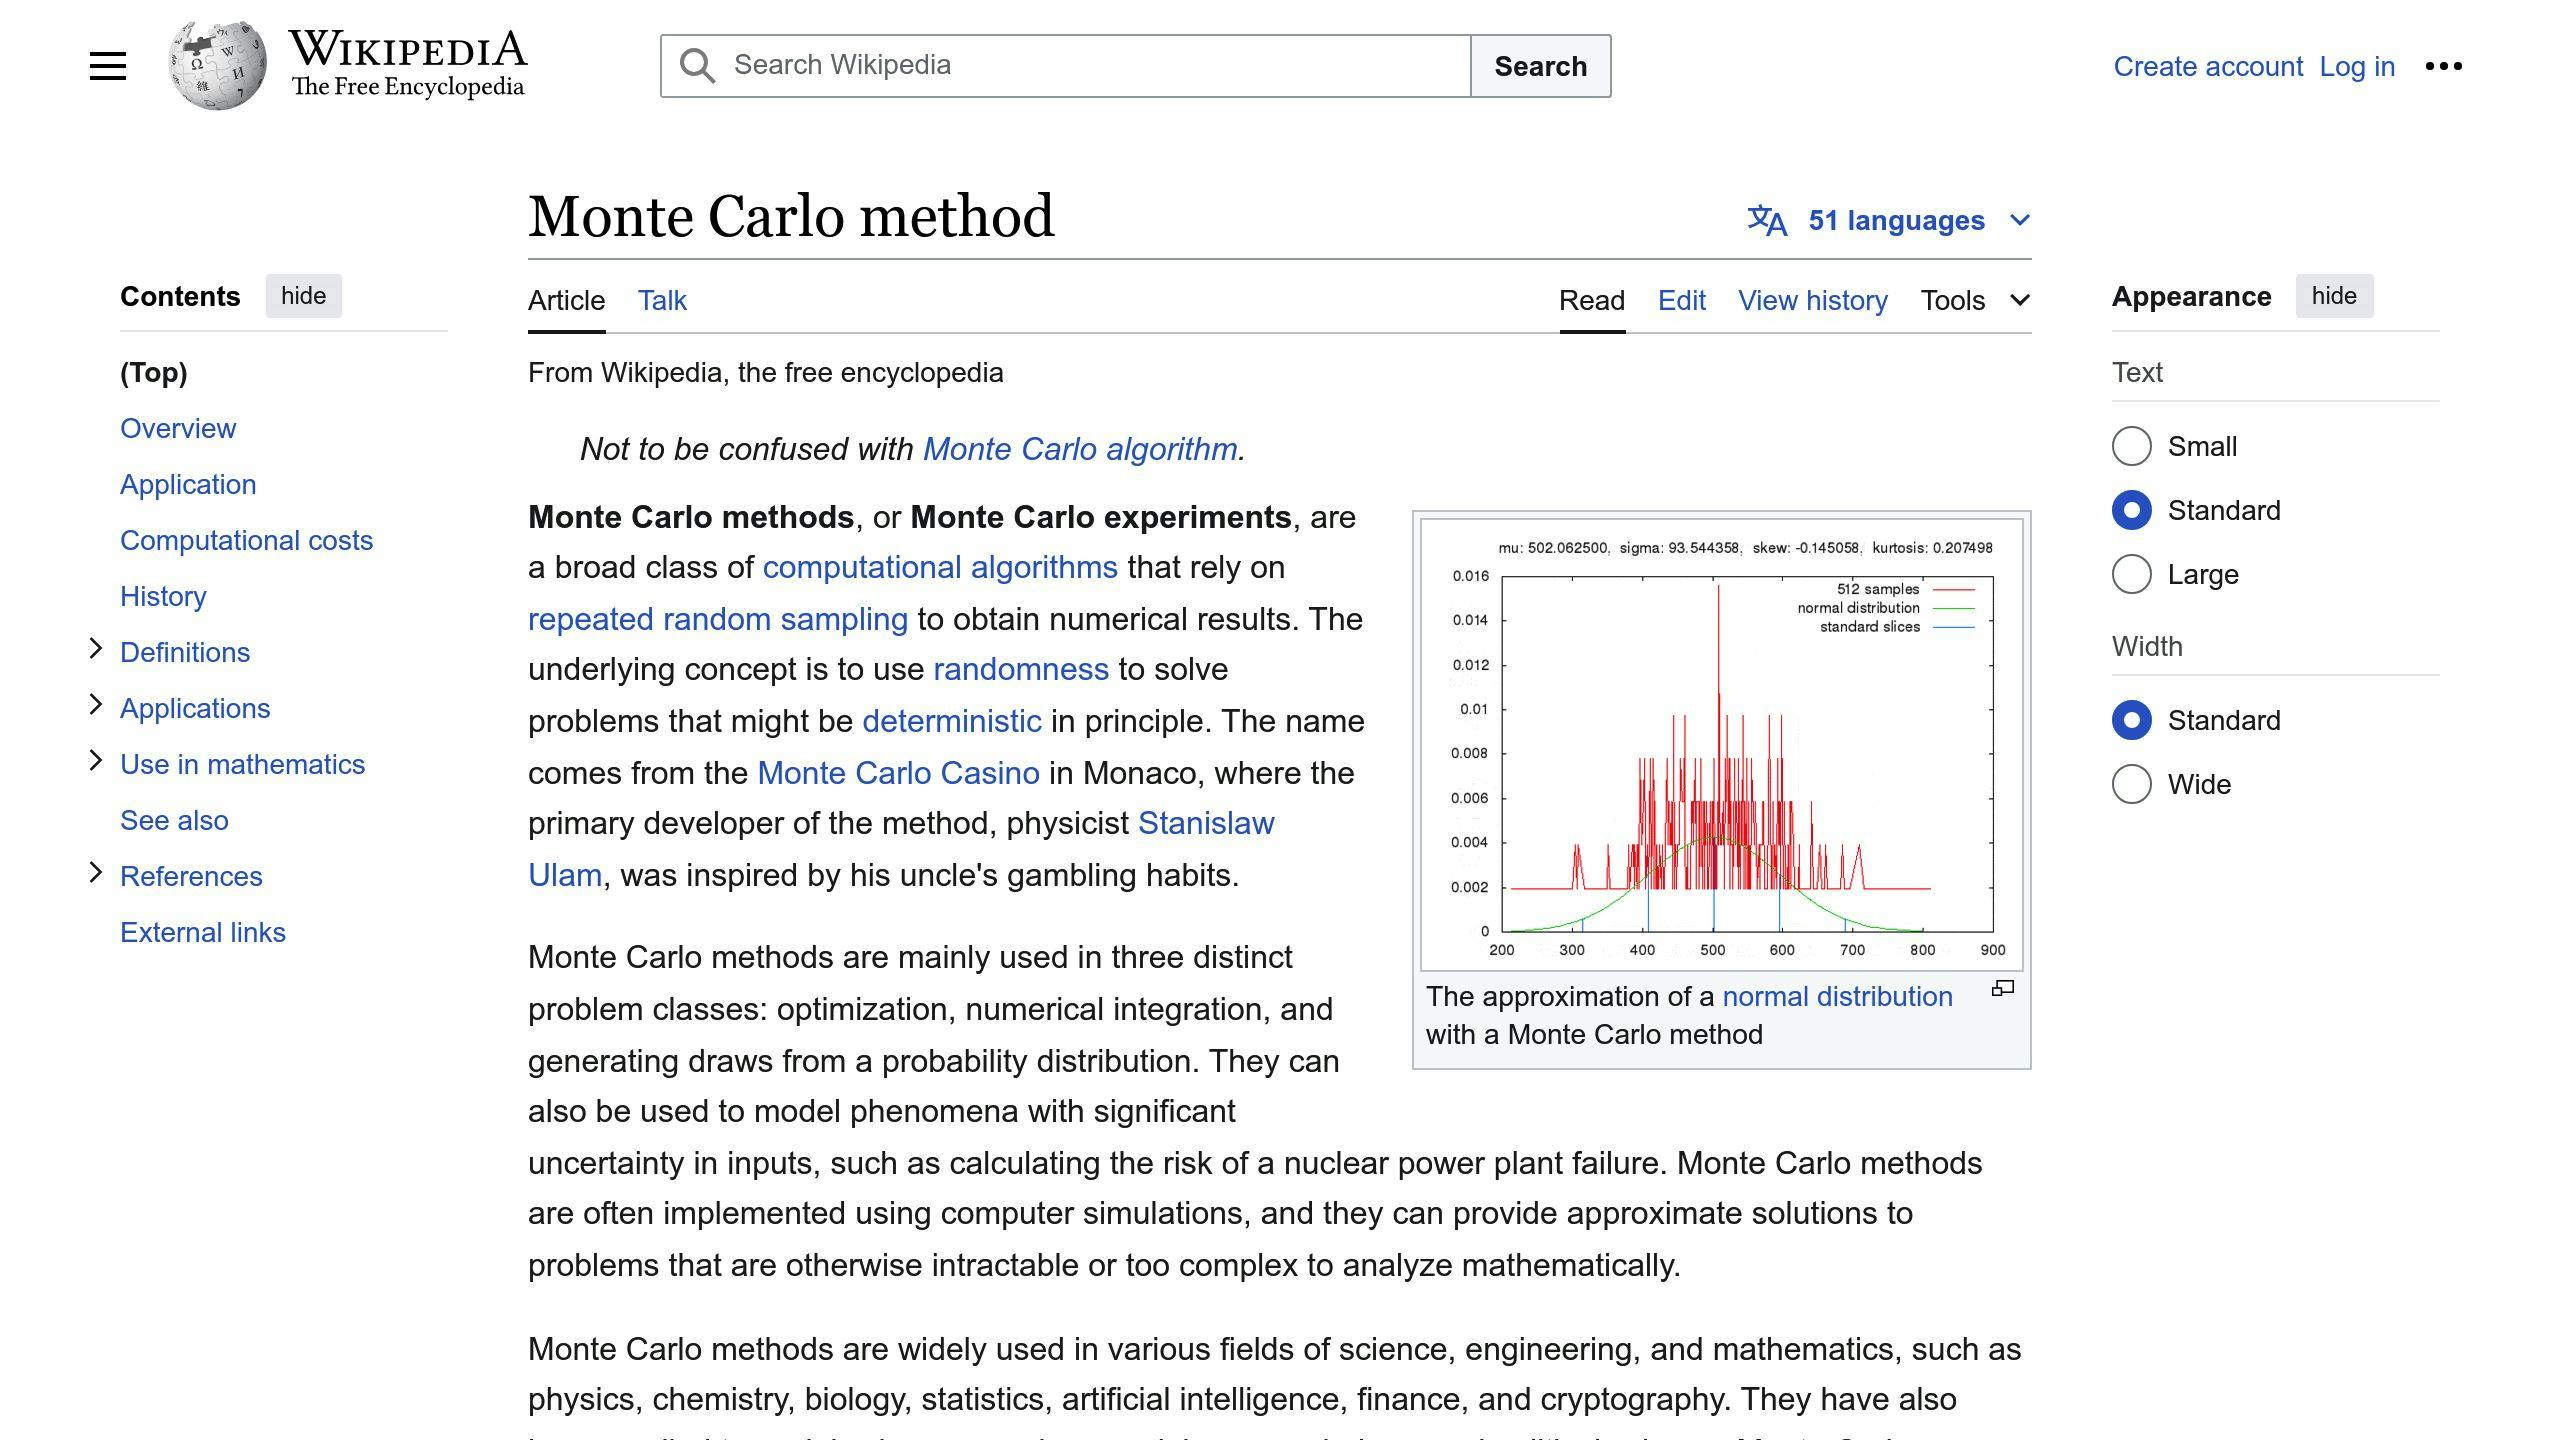
Monte Carlo simulation is a key tool for sizing up risks in big builds. It's all about using random numbers to see how uncertainty might shake things up.
How It Works in Infrastructure Projects
Project bosses use Monte Carlo to:
- Guess when a project might wrap up
- Spot potential money pits
- Check if they'll hit key dates
- Put a number on risks and their effects
Here's what a simulation might show:
| Project Length | Chance of Finishing |
|---|---|
| 12 months | 2% |
| 13 months | 15% |
| 14 months | 55% |
| 15 months | 95% |
| 16 months | 100% |
This info helps bosses make smart calls on timelines and where to put resources.
Pros and Cons
Pros:
- Shows a range of what might happen
- Puts a number on risks
- Leads to better choices
Cons:
- Needs lots of computer juice
- Only as good as the data you feed it
- Can't zoom in on single tasks
Real-World Example
In March 2023, the UK's HS2 rail project used Monte Carlo to check its budget and timeline. The results? A 50-50 shot at finishing Phase One by 2033 (two years late) and an 80% chance of needing £5 billion more.
Teaming Up with Other Methods
Monte Carlo often works hand in hand with other risk tools. For example, it can pair up with Fault Tree Analysis to figure out how likely things are to go wrong in complex builds.
2. Fault Tree Analysis (FTA)
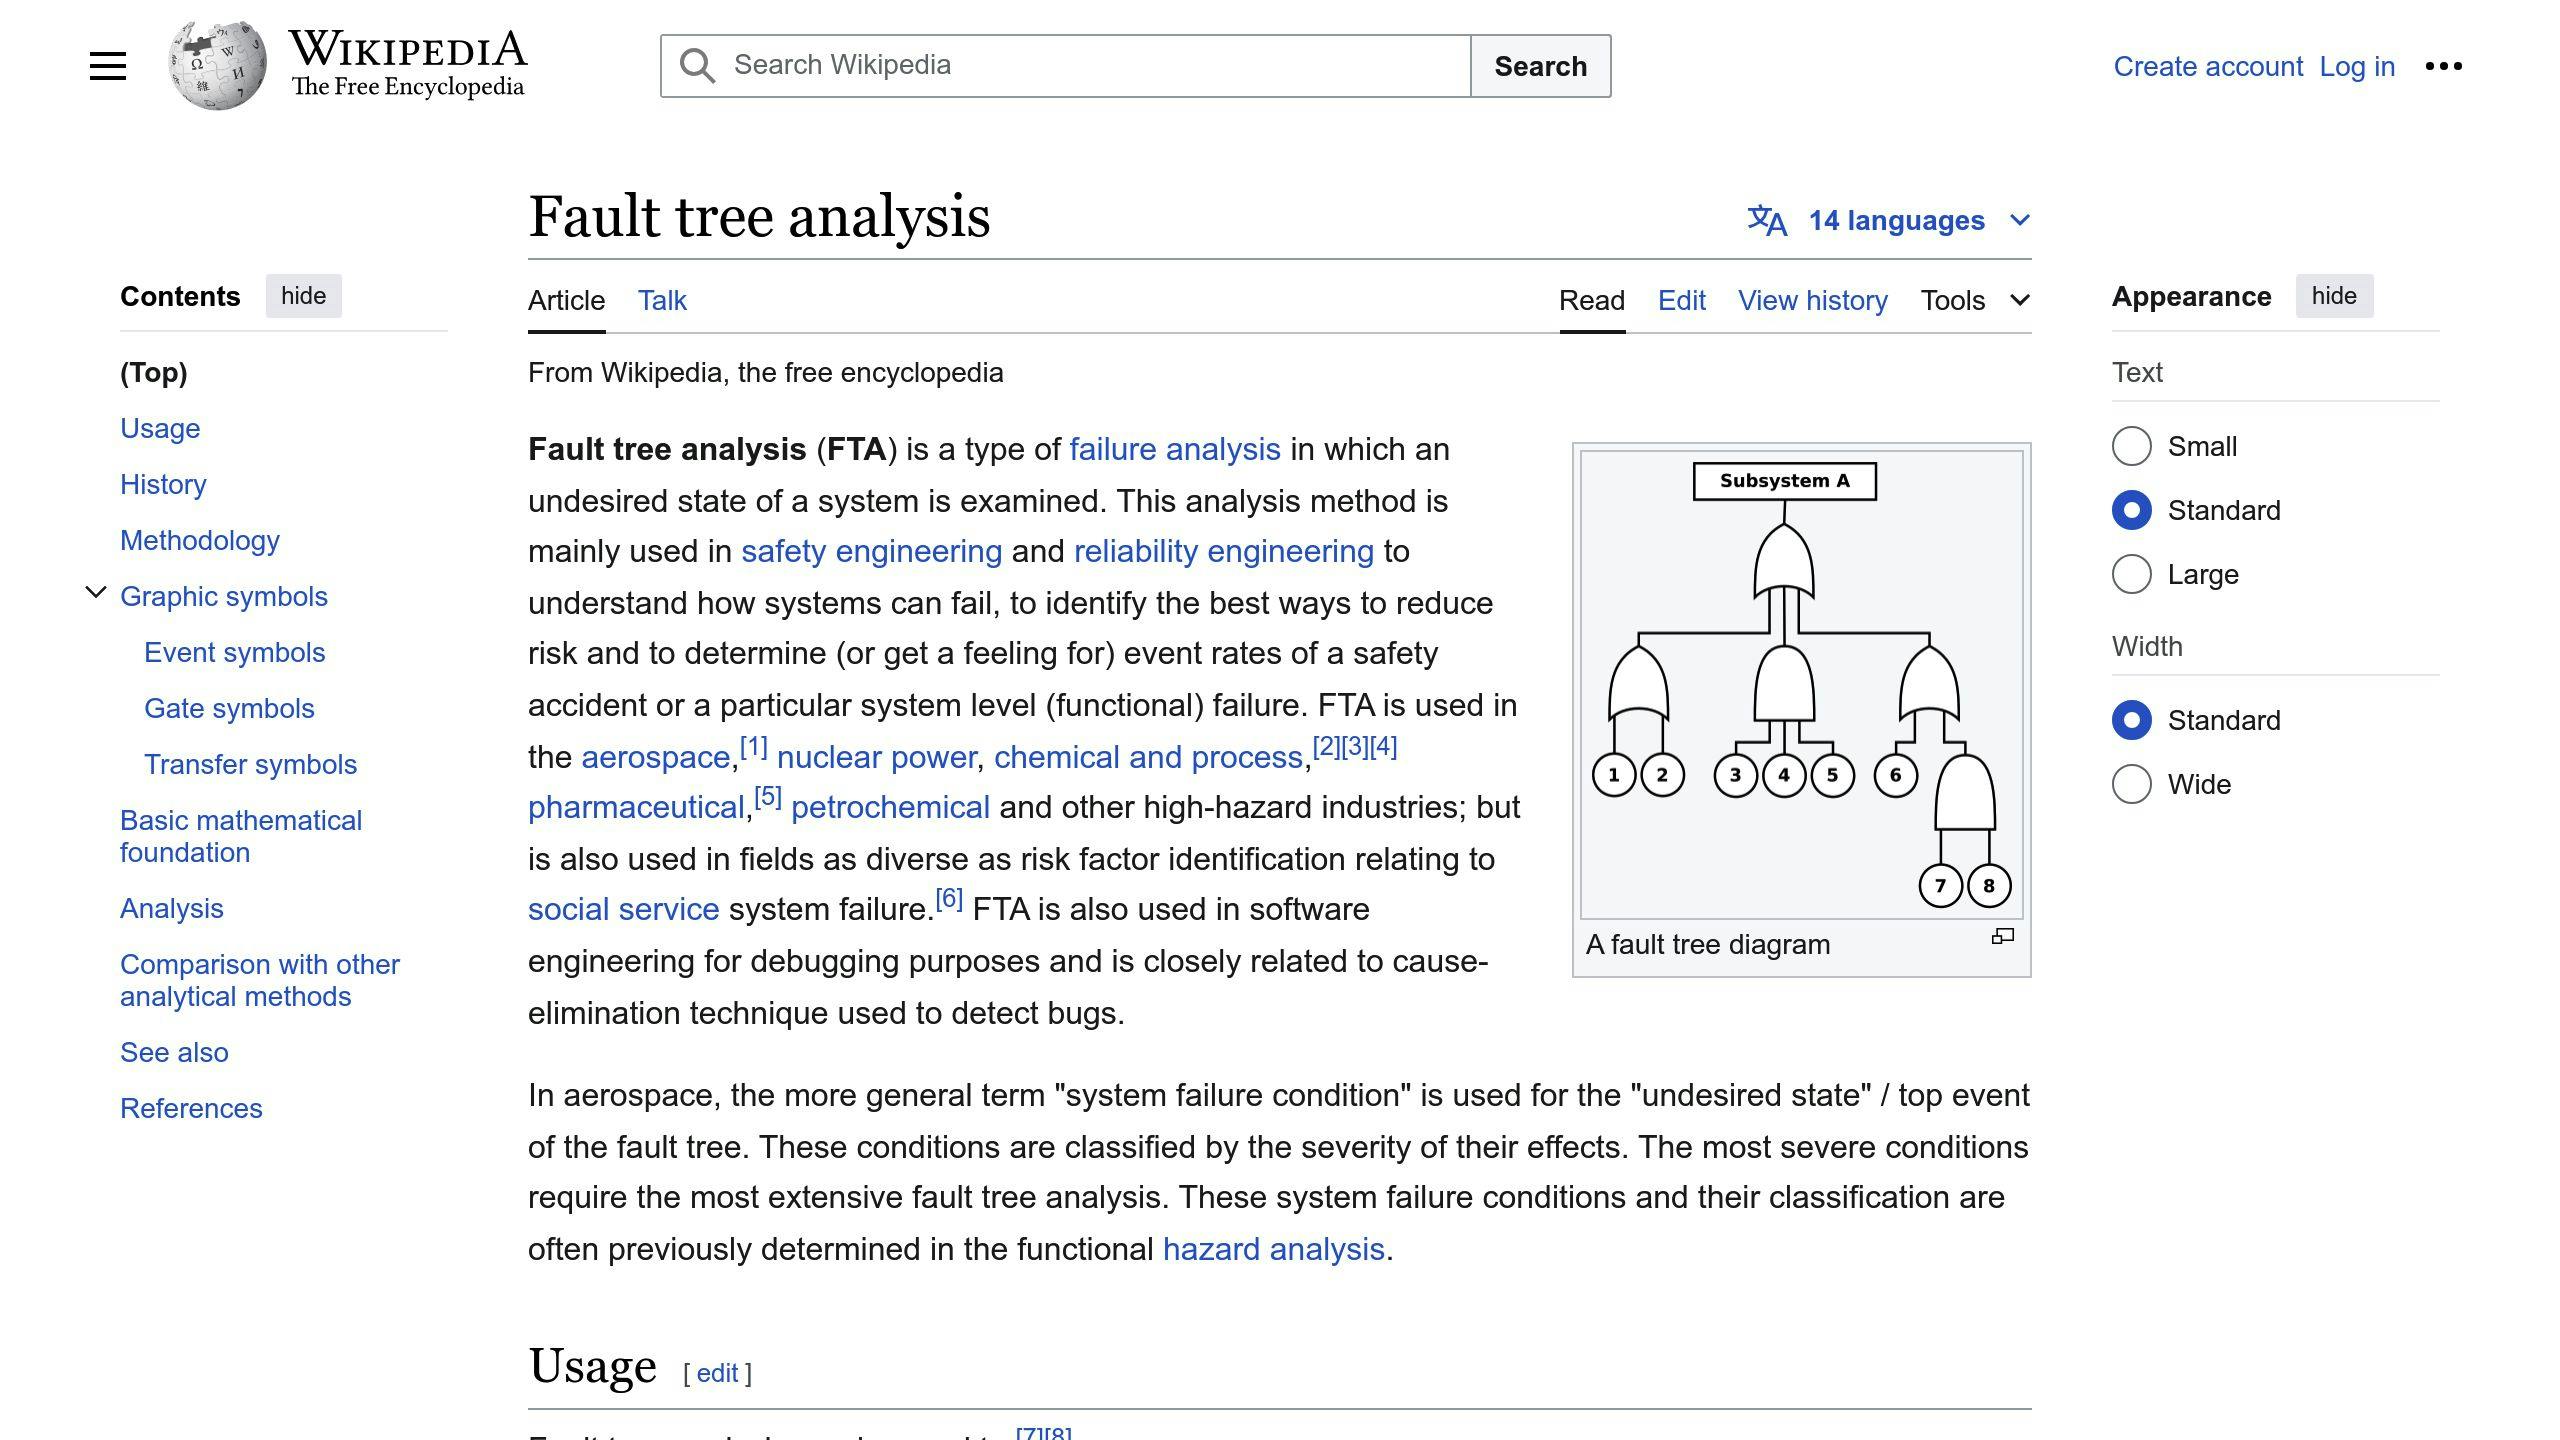
FTA is a top-down method for spotting risks in big projects. It's like a detective story, starting with the "crime" (major problem) and working backwards to find the "culprits" (causes).
How It's Used in Infrastructure Projects
Project managers use FTA to:
- Find weak spots
- Calculate failure odds
- Plan for the worst
- Boost safety
Here's a simple FTA for a bridge collapse:
Bridge Collapse
    |
    +-- Structural Failure
    |       |
    |       +-- Poor Materials
    |       |
    |       +-- Design Flaw
    |
    +-- Natural Disaster
            |
            +-- Earthquake
            |
            +-- Flood
This tree shows how different issues might lead to a big problem.
Pros and Cons
| Pros | Cons |
|---|---|
| Links problems clearly | Takes time |
| Spots critical issues | Data-hungry |
| Plays well with others | Might miss risks |
| Quantifies risks | Can get complex |
Real-World Example
In March 2023, the UK's HS2 rail project used FTA with Monte Carlo simulations. This combo helped spot potential delays and budget issues, leading to updated timelines and budgets.
Teaming Up
FTA often pairs with other risk tools:
- Monte Carlo: FTA provides structure, Monte Carlo adds numbers.
- FMEA: FTA looks top-down, FMEA bottom-up. Together, they give a full picture.
For instance, Additive Industries used both FTA and FMEA to check their MetalFAB1 3D printer. This combo helped them find and fix issues faster than using just one method.
3. Failure Mode and Effects Analysis (FMEA)

FMEA is a proactive method for spotting potential issues in infrastructure projects. Think of it as your project's early warning system.
How It's Used in Infrastructure Projects
Project managers use FMEA to:
- Break down complex systems
- Identify weak points
- Prioritise risks
- Plan targeted fixes
Here's the process:
- List potential failures
- Identify causes
- Assess consequences
- Score risks (likelihood, severity, detectability)
- Calculate Risk Priority Number (RPN)
- Address highest RPNs first
Strong Points and Weak Points
| Pros | Cons |
|---|---|
| Early problem detection | Time-consuming |
| Suits complex systems | Needs expert input |
| Helps prioritise | May miss unexpected issues |
| Promotes teamwork | Subjective scoring |
Real-Life Examples
In Shanghai's Jingqiao Development Zone, construction firms used FMEA at each building stage. This helped them anticipate and plan for potential issues.
A study on centrifugal pumps in a Regional Drinking Water Company found the shaft had the highest failure risk (RPN: 294). This insight guided their maintenance focus.
Working with Other Methods
FMEA often pairs with:
- Fault Tree Analysis (FTA): FMEA examines individual parts; FTA shows their interactions. Together, they provide a comprehensive view.
- Monte Carlo Simulation: FMEA identifies risks; Monte Carlo adds numerical probability to outcomes.
4. Decision Tree Analysis
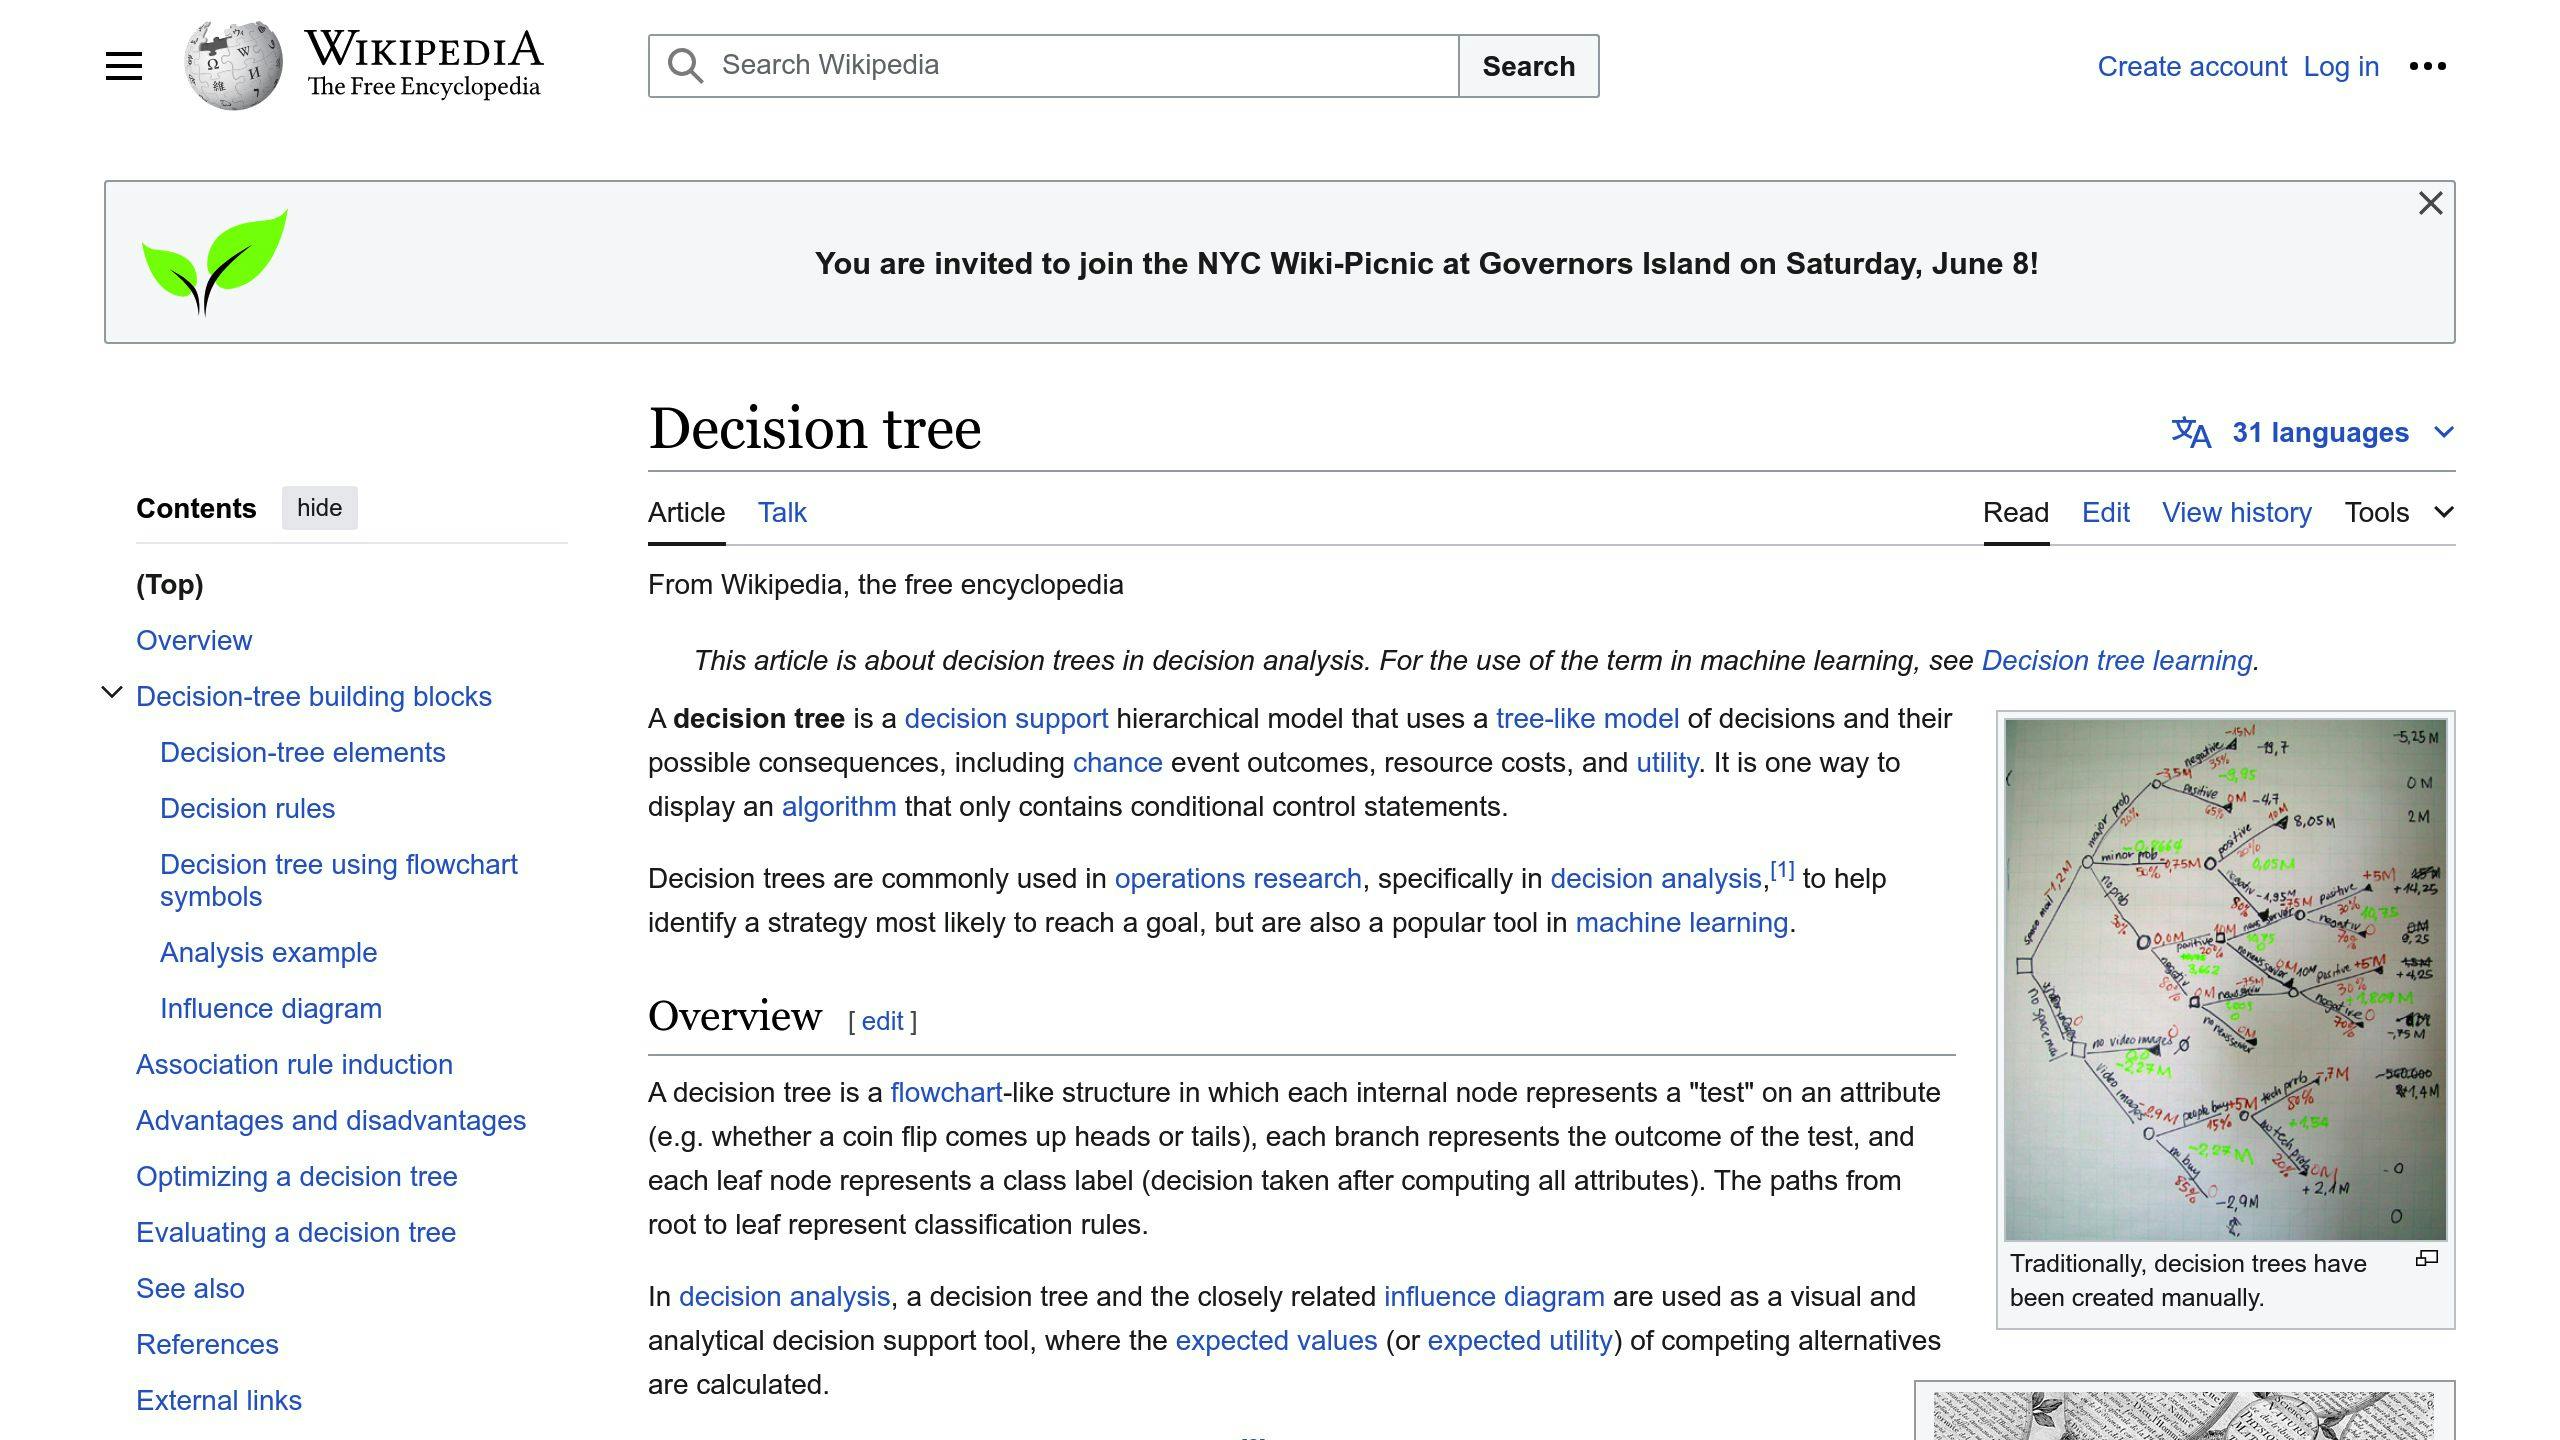
Decision tree analysis is a powerful tool for infrastructure project managers. It helps them make smart choices by mapping out what could happen and how much it might cost.
Here's how it works in real projects:
- It shows risks at each stage
- Compares different ways to build
- Helps decide where to spend money
- Looks at what delays could do
Managers draw a tree-like diagram. They start with the main choice and branch out to show what might happen next.
Pros and Cons
| Good Stuff | Not-So-Good Stuff |
|---|---|
| Easy to see and understand | Can get messy with lots of options |
| Puts numbers on risks and rewards | Needs good guesses about what might happen |
| Great for step-by-step decisions | Might make things look simpler than they are |
| Makes comparing options easy | Takes a long time for big projects |
Real-World Example
The UK's High Speed 2 (HS2) rail project used this method in 2021. They looked at different ways to dig tunnels. By mapping out possible problems with the ground and what they might cost, they picked a method that cut the risk of spending too much by 15%.
Teaming Up with Other Methods
Decision trees work well with other ways to check risks:
- Monte Carlo Simulation: The tree shows the big picture, and Monte Carlo fills in the details about what might happen.
- Failure Mode and Effects Analysis (FMEA): This finds ways things could go wrong, which then become new branches on the tree.
For example, when building London's Crossrail, managers used both decision trees and Monte Carlo simulations. This helped them figure out how different station designs would affect how long the project would take and how much it would cost.
Good and Bad Points
Let's look at the pros and cons of quantitative risk assessment models for infrastructure projects:
| Model | Pros | Cons |
|---|---|---|
| Monte Carlo Simulation | - Handles complex scenarios - Provides probability distributions - Good for cost and schedule risks |
- Data-hungry - Time-consuming - Needs expert input |
| Fault Tree Analysis (FTA) | - Focuses on specific failures - Suits complex systems - Identifies root causes |
- Might miss failure modes - Needs clear top event - Complex for large systems |
| Failure Mode and Effects Analysis (FMEA) | - Spots all possible failures - Useful in early design - Boosts reliability |
- Time-intensive - May miss interactions - Subjective risk scoring |
| Decision Tree Analysis | - Visually clear - Good for step-by-step choices - Compares options well |
- Messy with many options - May oversimplify - Needs accurate probabilities |
Each model has its strengths. For instance, HS2 used Decision Tree Analysis in 2021 to pick tunnel digging methods, cutting cost overrun risk by 15%.
These models often work best together. Crossrail combined Decision Trees with Monte Carlo simulations to assess station designs' impact on timelines and costs.
All quantitative methods share some downsides:
- They can be pricey (software, training).
- Results may seem too precise.
- Outputs need careful interpretation.
But quantitative risk analysis offers a consistent way to examine combined risks, leading to smarter decisions in complex projects.
Wrap-up
Quantitative risk assessment models are crucial for infrastructure project management. Here's how different models fit various project types:
1. Monte Carlo Simulation
Best for: Big, complex projects with lots of moving parts
HS2 in the UK used Monte Carlo to assess cost risks across project phases. Result? They spotted potential £1.3 billion overruns in the London-Birmingham section.
2. Fault Tree Analysis (FTA)
Best for: Projects with specific failure points
Crossrail in London used FTA to analyse potential signalling system failures. Outcome? 22% less system downtime during testing.
3. Failure Mode and Effects Analysis (FMEA)
Best for: Early-stage design and reliability checks
The Lower Sava River hydroelectric project in Slovenia used FMEA to spot eight high-risk activities. This helped them start operations on time.
4. Decision Tree Analysis
Best for: Projects with clear decision points
The "State Road No. 51 of Alemagna Vittorio Veneto" project in Italy used decision trees to compare construction approaches. Their cost forecast? Within 1.34% of final costs.
| Model | Best For | Real Example |
|---|---|---|
| Monte Carlo | Complex, variable-heavy projects | HS2 cost risk check |
| FTA | Specific failure point projects | Crossrail signalling analysis |
| FMEA | Early design and reliability | Lower Sava River project |
| Decision Tree | Clear decision point projects | State Road No. 51 in Italy |
Pro tip: These models work even better together. The World Bank found that mixing Monte Carlo with decision trees in developing countries improved risk strategies by 15%.
FAQs
What is sensitivity analysis in project risk?
Sensitivity analysis is a crucial tool for assessing risk in infrastructure projects. It shows how changes in specific variables impact the overall project outcome.
Here's the basic process:
- Choose a variable (like construction costs)
- Adjust its value
- See how this affects the project's risk profile
For instance, the Crossrail project in London used this method to evaluate how delays might impact costs. They found a 6-month delay could bump up costs by £1.6 billion.
"Our sensitivity analysis on the HS2 project showed a 10% increase in steel prices could lead to a £200 million cost overrun", said Mark Thurston, CEO of HS2 Ltd. "This helped us create better contingency plans."
Sensitivity analysis helps project managers:
- Identify high-impact variables
- Develop stronger risk strategies
- Make smarter decisions
The goal? Not to predict the future, but to understand what factors REALLY matter for your project's success.